For web developers and all other IT professionals, you are definitely going to want to read through this helpful overview guide on how to use Chrome Developer Tools. Otherwise known as "DevTools", these exceptionally effective web development tools are perfect for web authoring purposes, and debugging utilities constructed in Google Chrome. Chrome Developer Tools allow for deep access through the internal aspects of the Chrome browser and for developers to inspect the internals of applications they are working on. By utilizing the Chrome DevTools effectively, web developers can streamline their process for isolating layout problems, determining JavaScript breakpoints, along with the ability to gain insights into ways to optimize your code. To benefit web developers and anyone else interested in learning more about the Chrome Developer Tools, the eight primary DevTool categories will now be listed and explained briefly.
• Chrome DevTool #1 - Elements:
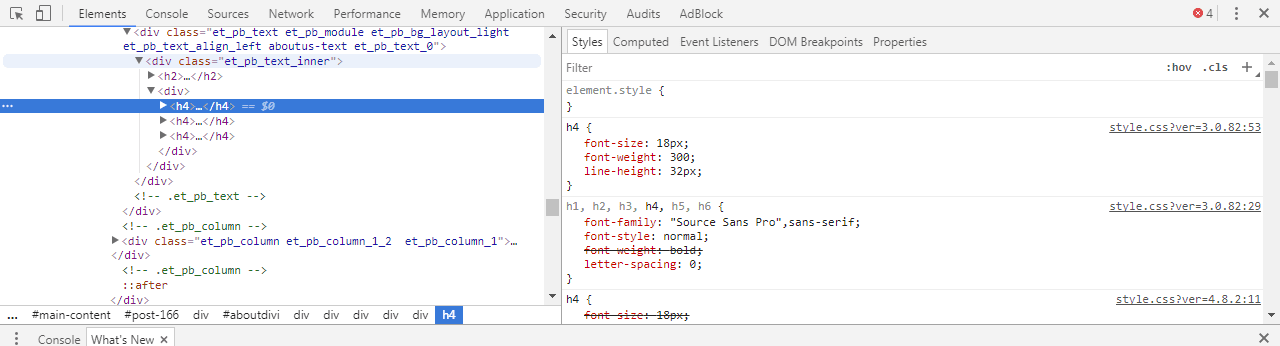
The Chrome Developer Tools are generally organized into different task-specific groupings on the toolbar located near the top end of the work window. Every toolbar action and corresponding panel allow for working with specified pages or application data, including sources, resources, and DOM elements. The first of the eight primary groupings of Chrome DevTools is the Elements category.
Elements allows web developers to view everything being worked on within one single DOM tree format, permitting an instant viewing capability and quick editing of the relevant DOM elements. Developers will usually be using the Elements portion of the DevTools layout when needing to figure out the HTML excerpt for a given aspect of a page being worked on. You can also use Elements to determine if a particular image has an attribute based on HTML, and if so, what the specified value is.
• Chrome DevTool #2 - Resources:
Using the Resources portion of the Chrome DevTool layout, web developers can inspect isolated resources that may be loaded into a specified page. The Resources segment of the Chrome Developer Tools will also allow people to easily interact with Local Storage, AppCache, HTML5 Database, Cookies, and more. This aspect of the DevTools array will be extremely helpful for streamlining processes and making development work more efficient overall.
• Chrome DevTool #3 - Network:
For a third Chrome Developer Tool section that can be a tremendous amount of help is the Network feature. The Network paneling helps to provide developers with certain resources that can be downloaded and requested through a network on a real-time basis. For web developers who are striving to fully optimize their pages, using the Network feature is highly effective since it can help to both identify and address the requests that are taking much more time than initially predicted. Overlooking this aspect of web page optimization can really hurt efficiency, so you will want to use the Network feature quite frequently during development work.
• Chrome DevTool #4 - Sources:
The Sources panel included in the Chrome DevTools layout is another helpful utility for web developers, and it runs as a kind of support and auxiliary aspect of the Resources tool. These tools accomplish similar tasks and operate concurrently, and so reviewing the Resources aspect of the Chrome Developer Tools can help to provide more information about the Sources tool panel.
• Chrome DevTool #5 - Timeline:
By operating the Timeline tool panel option on the DevTool layout, web developers can review comprehensive overviews of how time is being spend in terms of both loading and utilizing your own web application or website. The basic graphic representation provided by the Timeline panel involves the plotting of all relevant events along a timeline, which permits developers to visually review these events in a rapid and easy way. Every single relevant event, including resource loading, JavaScript parsing, calculating of styles, along with repainting are all individually plotted on the visual timeline.
• Chrome DevTool #6 - Profiles:
The Profiles section of the Chrome Developer Tools layout is one of the more complex and involved aspects of the DevTools system, and it is a multifaceted tool panel. Profiles is a DevTools panel that can allow web developers to quickly determine the particular executions times and usage of memory by a given web application or website. Using the Profiles panel, you can understand precisely where critical resources are being used, and therefore the Profiles panel can definitely assist in terms of code optimization.
The three main profilers offered with this portion of the Chrome DevTools include the JavaScript profiler, the Heap profiler, and the CPU profiler. For showing exactly where execution time is being spent within your scripts, the JavaScript profile is the tool for the job. The CPU profiler is capable of displaying where executions time allocation is going within a page or application's Java Script functionality. Finally, the Heap profiler is intended for use in displaying relevant memory distribution being carried out by your website's JavaScript related DOM nodes and other objects.
• Chrome DevTool #7 - Audits:
Using the Audits feature that is built into the Chrome DevTools layout, web developers can quickly and successfully analyze pages as they are in the process of loading. After the page has loaded, the Audits panel can also give you optimization suggestions that are geared toward minimizing page loading times. The Audits panel is also intended to improve upon page responsiveness overall. The Audits tool is a truly critical aspect of the comprehensive Chrome Developer Tools layout, and it will be a primary source of suggestions for efficiency streamlining of applications and web pages.
• Chrome DevTool #8 - Console:
Within the overall Chrome Developer Tools panel layout, one of the most important tool panels is the JavaScript Console working in tandem with the Console API. In a general sense, the Console function works to provide a total of two main functions designed to assist web developers in the task of testing their various websites and web applications. The Console is a hub for accessing critical testing features, and one of these features involves the logging of diagnostics data and information into the web development process. A shell prompt is capable of being used for interaction with primary documents and Chrome Development Tools. The evaluation of different expressions directly within the Console is possible through the use of methodology provided through the Command Line API.